Mozilla Corporation organization representation, 2022 data
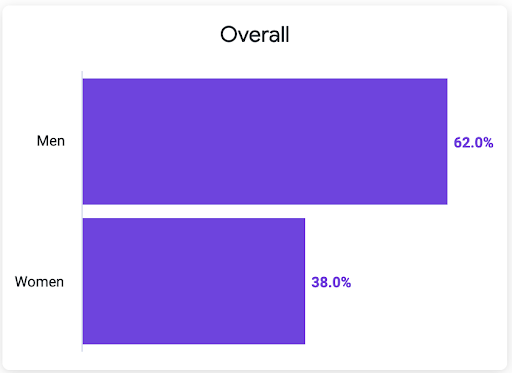
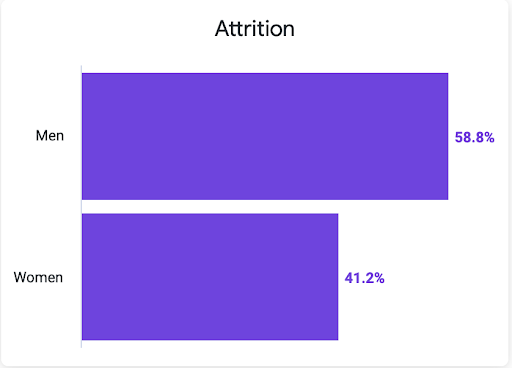
Gender
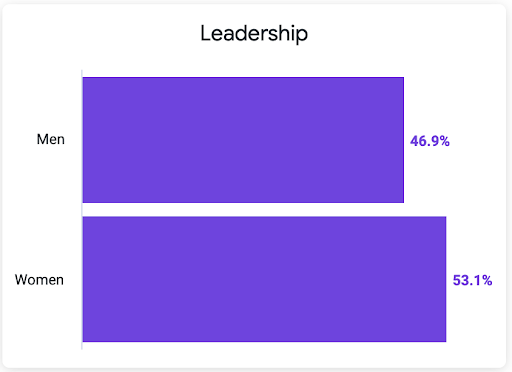
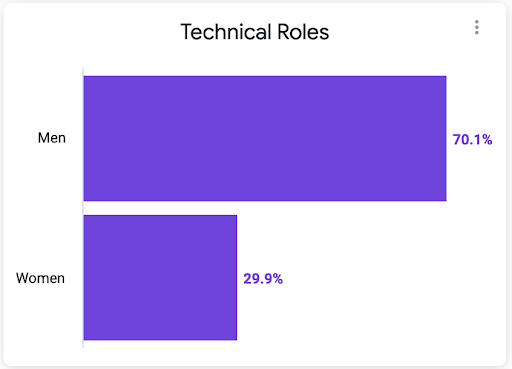
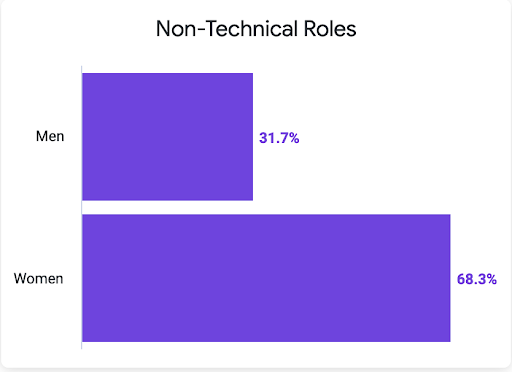
Women continue to make up a little over one-third of the Mozilla Corporation’s workforce. We have made strides in achieving gender parity in leadership (director+) with women now representing 53.1% of leadership roles, a 4.7% increase since last year. We also note a 1.7% increase in women in technical roles from 2021 to 2022.Currently, fewer than 1% of Mozilla Corporation employees select “other gender identities.” We recognize that gender identities exist on a spectrum.

Race and ethnicity (U.S. only)
In 2022, the percentage of Black/African-American Mozillians in the U.S. in leadership roles increased from 9.6% to 11.3%. We measured slight growth in the Hispanic/Latinx employee population. In 2022, Hispanic/Latinx Mozillians accounted for 4.5% of the U.S. employee base and 4.8% in technical roles; in 2021, the numbers were 4.4% and 4.1%, respectively. Additionally, Hispanic/Latinx Mozillians represented 2% of hires and 1.5% of departures in 2022.
In addition to increases, we also have opportunities worth monitoring. We measured a decrease in the hiring rates among Asian employees, and also saw a year-over-year decrease in leadership representation from 15.4% to 11.3%. The decreases in retention and leadership representation were mostly driven by the 16.9% attrition rate of Asian employees in 2022.


Intersection of gender, race, and ethnicity (U.S. only)
We are relatively gender-balanced in Hispanic/Latinx while we have more Asian women than men, slightly more Black/African American women than men, and fewer White women than men at Mozilla Corporation.

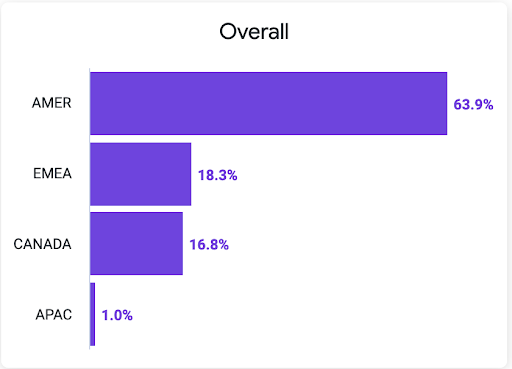
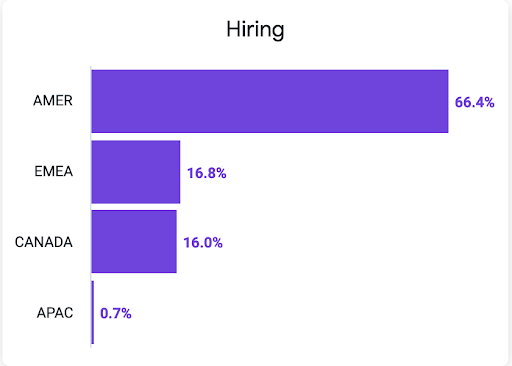
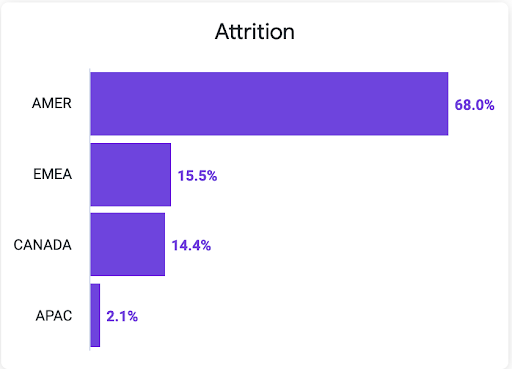
Region
The majority of the Mozilla Corporation’s staff is regionally located throughout parts of the United States, South America, & Central America with a significant number of employees distributed across Canada and the EMEA (Europe, Middle East and Africa) region. Hiring rates and attrition are roughly equal across regions, with hiring slightly above attrition in Canada, EMEA, and hiring slightly lower than attrition in the U.S. and Asia Pacific.
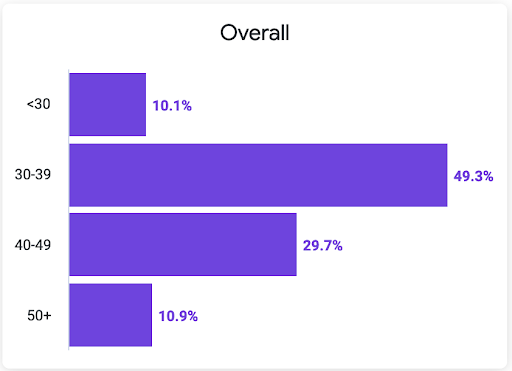
Age
Roughly 40% of staff at the Mozilla Corporation are at or over the age of 40, up about one percentage point from the prior year. The median age of our staff at Mozilla Corporation is 37 years old, remaining the same from our 2021 disclosure.
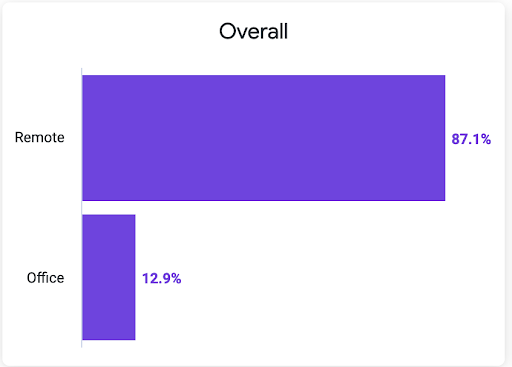
Working location
Mozilla Corporation has continued to embrace remote working over the years, and our remote work culture has remained strong. We currently have 87.1% of our workforce working remotely, which is up from 73.8% in 2021.
Methodology
- All diversity data are self-reported and come from the Mozilla Corporation and Foundation’s human resources information system for regular employees as of December 31, 2022. Progress over 12 months is compared against December 31, 2021.
- Staff at the Mozilla Corporation includes only regular, full-time employees. Staff at the Mozilla Foundation includes regular, full-time employees and fixed-term employees, as some fixed-term staff are tied to grants or specific funding sources.
- Currently, fewer than 1% of Mozilla Corporation employees select “other gender identities.” We recognize that gender identities exist on a spectrum.
- In order to be in compliance with global laws, we do not track race and ethnicity outside of the United States at this time. All race and ethnicity data are for employees in the United States only, and categories are driven by United States government requirements for disclosure.
- Leadership representation excludes executive-ranked technical fellows and only includes all levels of directors, vice presidents and the executive team.
- Technical workers are defined as staff working on our products and within IT.
- Only voluntary departures are included in attrition calculations.
- Employees who opted to decline to provide demographic data are not included in the metrics provided.
- Some categories may not add up to 100% if fields were left blank or listed as “other.”
- In the event of comparison to historical reports: Any differences in values of historical data are due to data corrections and/or updates (e.g. if an employee made a change to their demographic information, we are using their most recent data for all past years).